
How to Use Show Buildability to Find Buildable Areas on a Property
A property can have significant slope and still contain areas that may be suitable for building.
Land Portal's Show Buildability feature helps you identify these areas directly on the map by highlighting clusters of land that meet the platform's buildability criteria based on slope.
Instead of relying only on the property's average slope, you can see where flatter, potentially buildable areas are located and how much usable acreage may be available.
This can be especially helpful when evaluating properties in mountainous or sloped markets, where a parcel may look difficult to build on at first glance but still contain usable areas.
Step by step walkthrough
-
Log in to Land Portal
Log in to Land Portal and locate the property you want to analyze on the map.
-
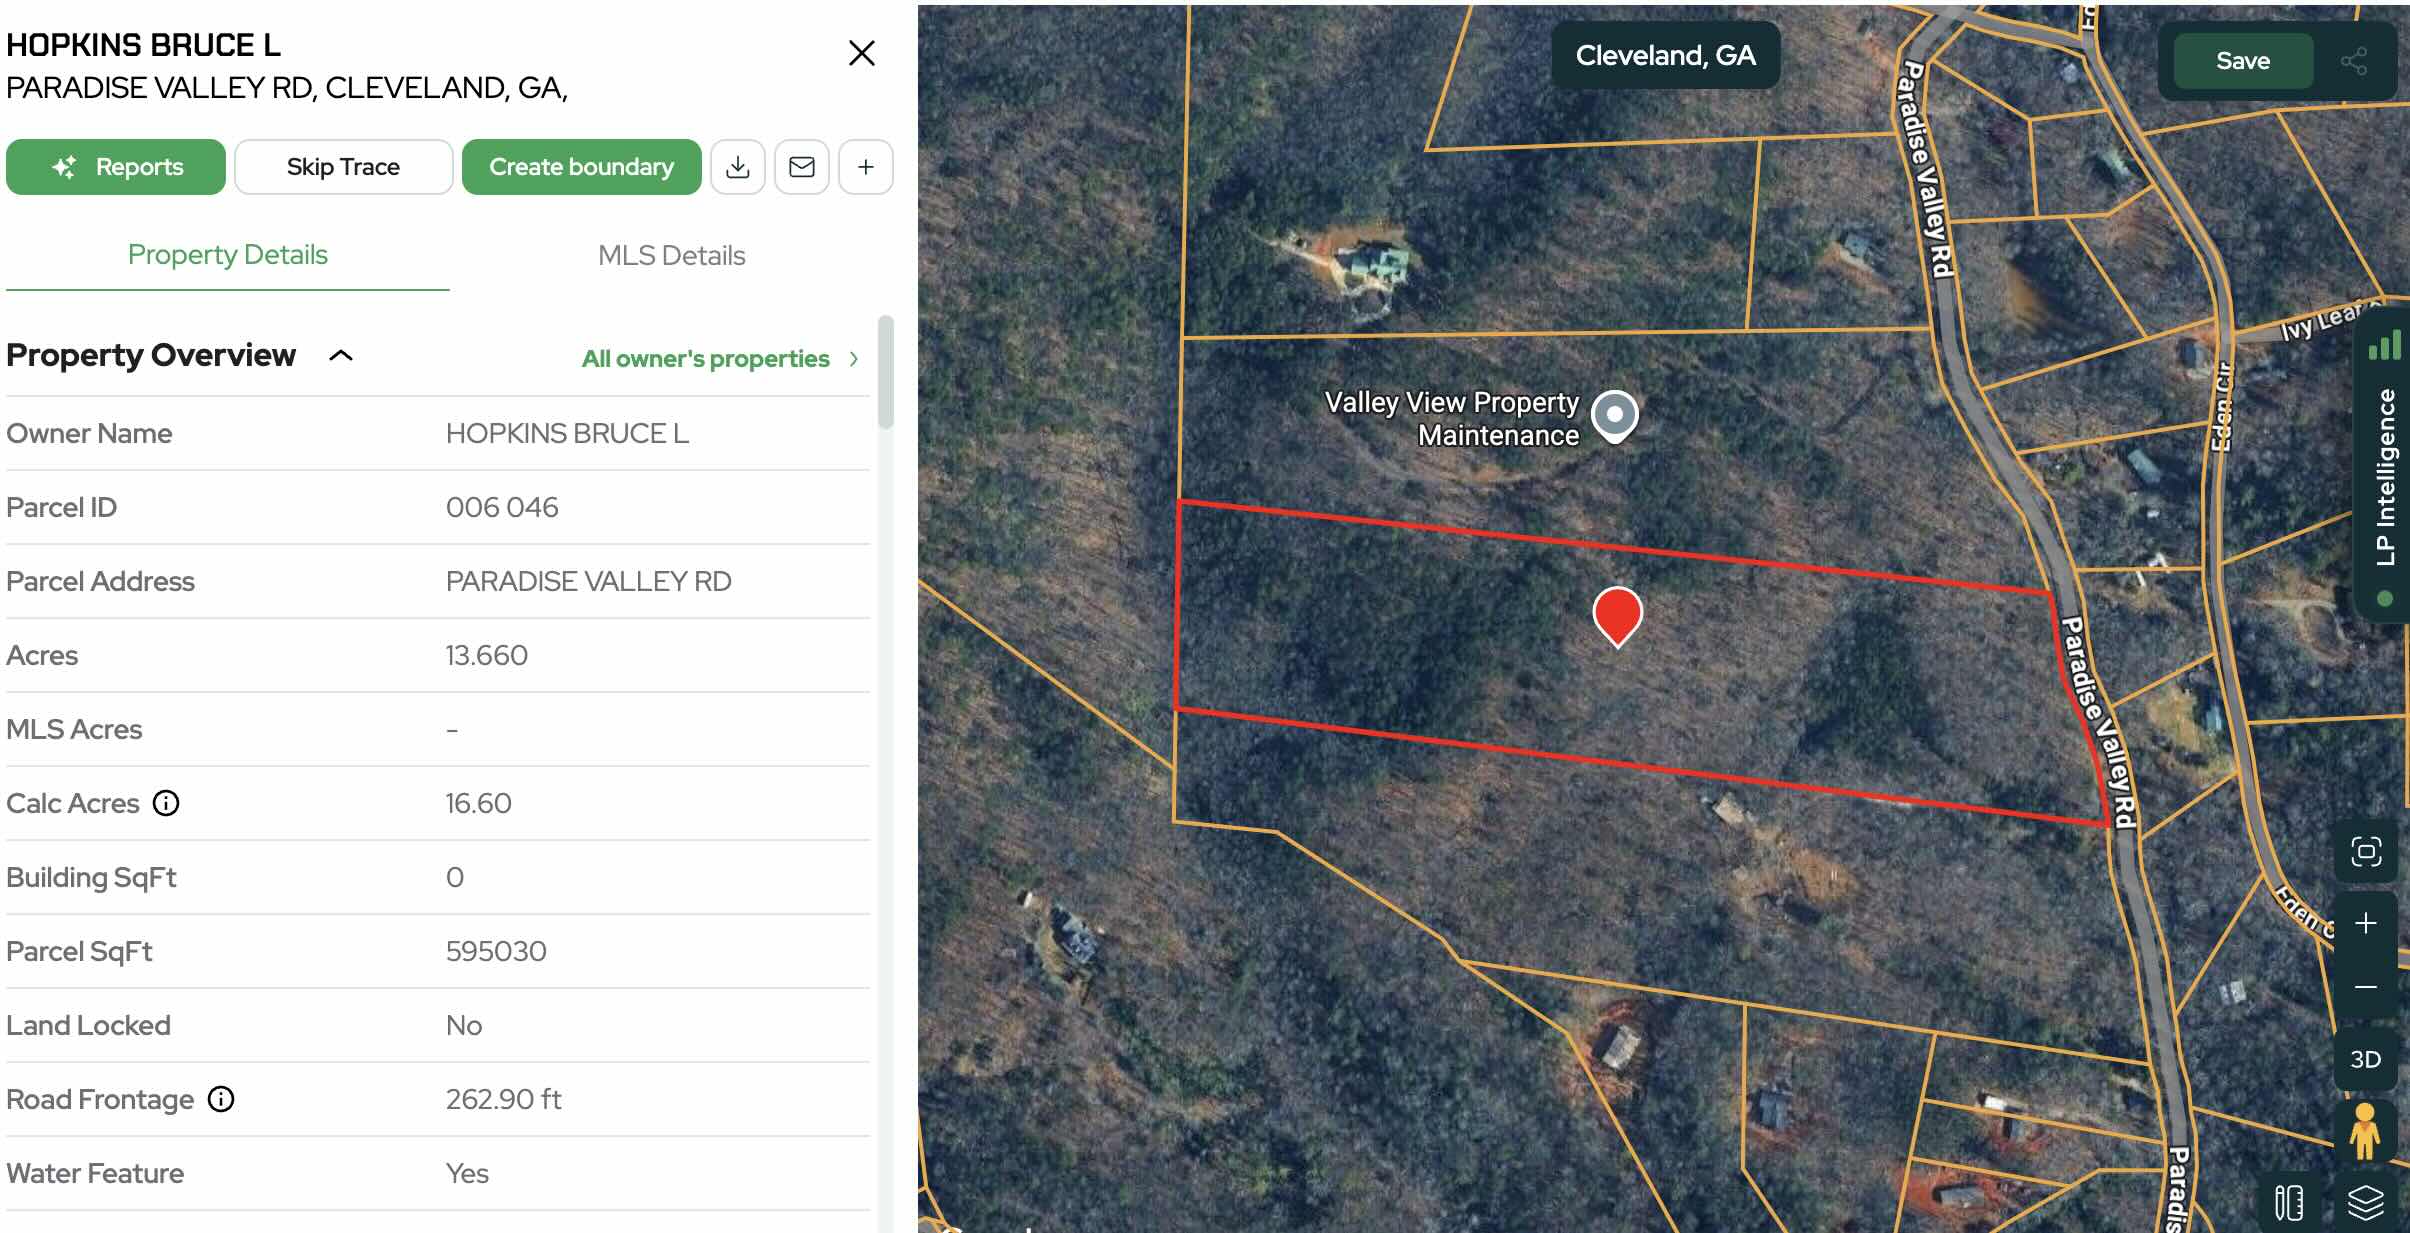
Open the Property Card
Click on the parcel to open its Property Card, where you can review detailed information about the property.
-
Find the Slope Analysis Section
Scroll down on the Property Card until you reach Slope Analysis.
Here, you'll find information including the property's Buildability Percentage, Buildability Acres, average slope, and the percentage of the property that falls within different slope ranges.
Note: Some tools and filters are only available on certain plans. See Plans & Pricing for what’s included in your subscription.

- Review Buildability Percentage and Acres
The Buildability Percentage shows how much of the property Land Portal has identified within buildable clusters, while Buildability Acres gives you the approximate total acreage within those areas.
This is particularly useful on sloped properties. Even when much of a parcel has significant slope, Land Portal can identify flatter clusters within the property that may be more suitable for building.
- Click Show Buildability
Click Show Buildability to display the identified buildable clusters directly on the map.
This allows you to see where the potentially buildable areas are located instead of relying only on the overall slope numbers.

- Review the Buildable Clusters on the Map
Look at where each cluster sits within the parcel and consider its location in relation to the road, property boundaries, and surrounding terrain.
A buildable area located deeper into a sloped property, for example, may still require additional consideration for driveway access and site preparation.

- Use 3D View for Additional Context
For sloped properties, you can turn on 3D View while displaying the buildable areas.
This provides another perspective on how the clusters fit into the property's overall terrain and can help you better understand the slope leading to and surrounding those areas.

- Generate a Slope Report for More Detail
If you want to investigate the property further, generate a Slope Report from the Reports section of the Property Card.
The Slope Report provides more detailed information about the property's terrain and individual buildable clusters, including cluster size and the slope characteristics within each area.

For a complete breakdown of what the report shows and how to interpret the data, check out How to Analyze the Slope Report.
Why Use Show Buildability?
Looking only at average slope doesn't always tell the full story.
A property could have a high average slope while still containing flatter areas that may be suitable for building. Show Buildability helps you locate those areas quickly so you can make a more informed decision about whether a property deserves further due diligence.
Buildability data should be used as a starting point for evaluating a property, not as confirmation that construction is possible. Zoning, access, utilities, soils, setbacks, permitting requirements, and other factors can also affect whether a specific area can actually be developed.
When you're ready to evaluate your next property, log in to Land Portal and use Show Buildability to quickly identify potential buildable areas directly on the map.